CAEP Accreditation - Department of Education
Candidate Competency at Completion
Measure 3:
The EPP ensures candidates have content knowledge and are able to apply that knowledge at the appropriate progression levels. Candidates are able to apply critical content for their concentration proficiency to all P-12 students. Candidates also demonstrate a positive impact on P-12 student learning and content. The basis for judging candidate performance was well-defined and documented by the VDOE in the requirements for teacher licensure. ETS set the standards for scoring and the state of Virginia determined the thresholds. PRAXIS II subject tests measure knowledge of core subject areas such as Mathematics, Biology, English, and Music. These exams are taken prior to entry into clinical practice (Student Teaching). The passing scores indicate a proficient level of content knowledge required for teaching. All candidates must meet or exceed the State minimum to pass and be eligible for entry into clinical practice (student teaching). Passing scores for the Praxis II assessment are set by the Virginia Department of Education (VDOE) and the Virginia General Assembly.
Assessment measures and sources of evidence provide the methods, data, and materials used to assess areas of quality. Each area, reading and writing, is assessed using a set of quantitative data methods and measures. Quantitative data, obtained from VCLA, is processed, evaluated, and disaggregated to determine content knowledge and the extent to which it is being met for candidates. The VCLA is used to measure students’ basic skills in reading and writing to ensure proficiency in the basic skills and knowledge needed for successful matriculation in the Approved Teacher Education Program.
Praxis II Results
| GPA(Cumulative) | Praxis II–Reading(157) Major: IDS |
Praxis II-SS(155) Major: IDS |
Praxis II-Math(157) Major: IDS | Praxis II-Science(159) Major: IDS |
Praxis II- RVE (157) | Praxis II- Teaching Reading (159) | Praxis II-Music(160) Major: Music |
Praxis II-Math (160) Major: Math |
Praxis II Health/PE Major: HPE |
Praxis II Biology (155) Major: Biology |
|
| FALL 2020 | |||||||||||
| IDS (N=1) | 3.82 | 175 | 188 | 192 | 192 | 174 | --- | --- | --- | --- | |
| SPR 2021 | |||||||||||
| IDS (N=2) | 3.6 | 172.5 | 171 | 194.5 | 181.5 | 169.5 | --- | --- | --- | --- | |
| MATH ED (N=1) | 3.96 | --- | --- | --- | --- | --- | --- | --- | 167.87 | --- | |
| BIO ED (N=1) | 3.53 | --- | --- | --- | --- | --- | --- | --- | --- | --- | 156 |
| FALL 2021 | |||||||||||
| HPE (N=1) | 4.1 | --- | --- | --- | --- | --- | --- | --- | --- | 170 | |
| IDS (N=1) | 2.8 | 164 | 152.67 | 158.5 | 169 | 159 | --- | --- | --- | --- | |
| SPR 2022 | |||||||||||
| MUSIC ED (N= 1) | 3.54 | --- | --- | --- | --- | --- | --- | 163 | --- | --- | |
| SPR 2023 | |||||||||||
| IDS (N=3) | 3.62 | 169.3 | 166 | 188.67 | 164 | --- | 163.3 | --- | --- | --- | |
| FALL 2023 | |||||||||||
| IDS (N= 1) | 158 | 168 | 183 | 164.5 | --- | 155.5 | --- | --- | --- | ||
| MUSIC ED (N=1) | --- | --- | --- | --- | --- | --- | --- | --- | |||
| Average | 167.76 | 169.13 | 174.2 | 173.5 | 167.5 | 159.4 | 163 | 167.87 | 170 | ||
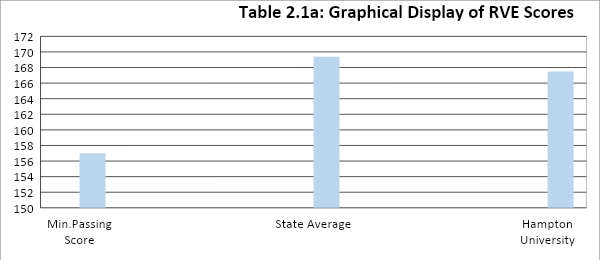
Reading for Virginia Educators Results
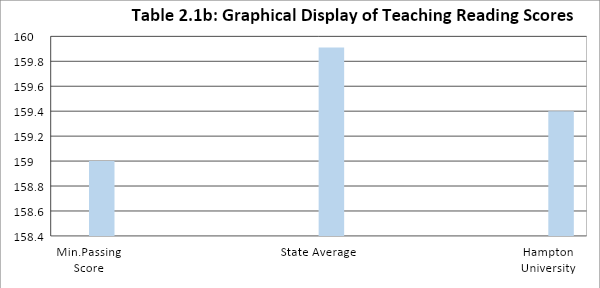
Teaching Reading Results
Virginia Communication Literacy Assessment (VCLA) Results